May 2026
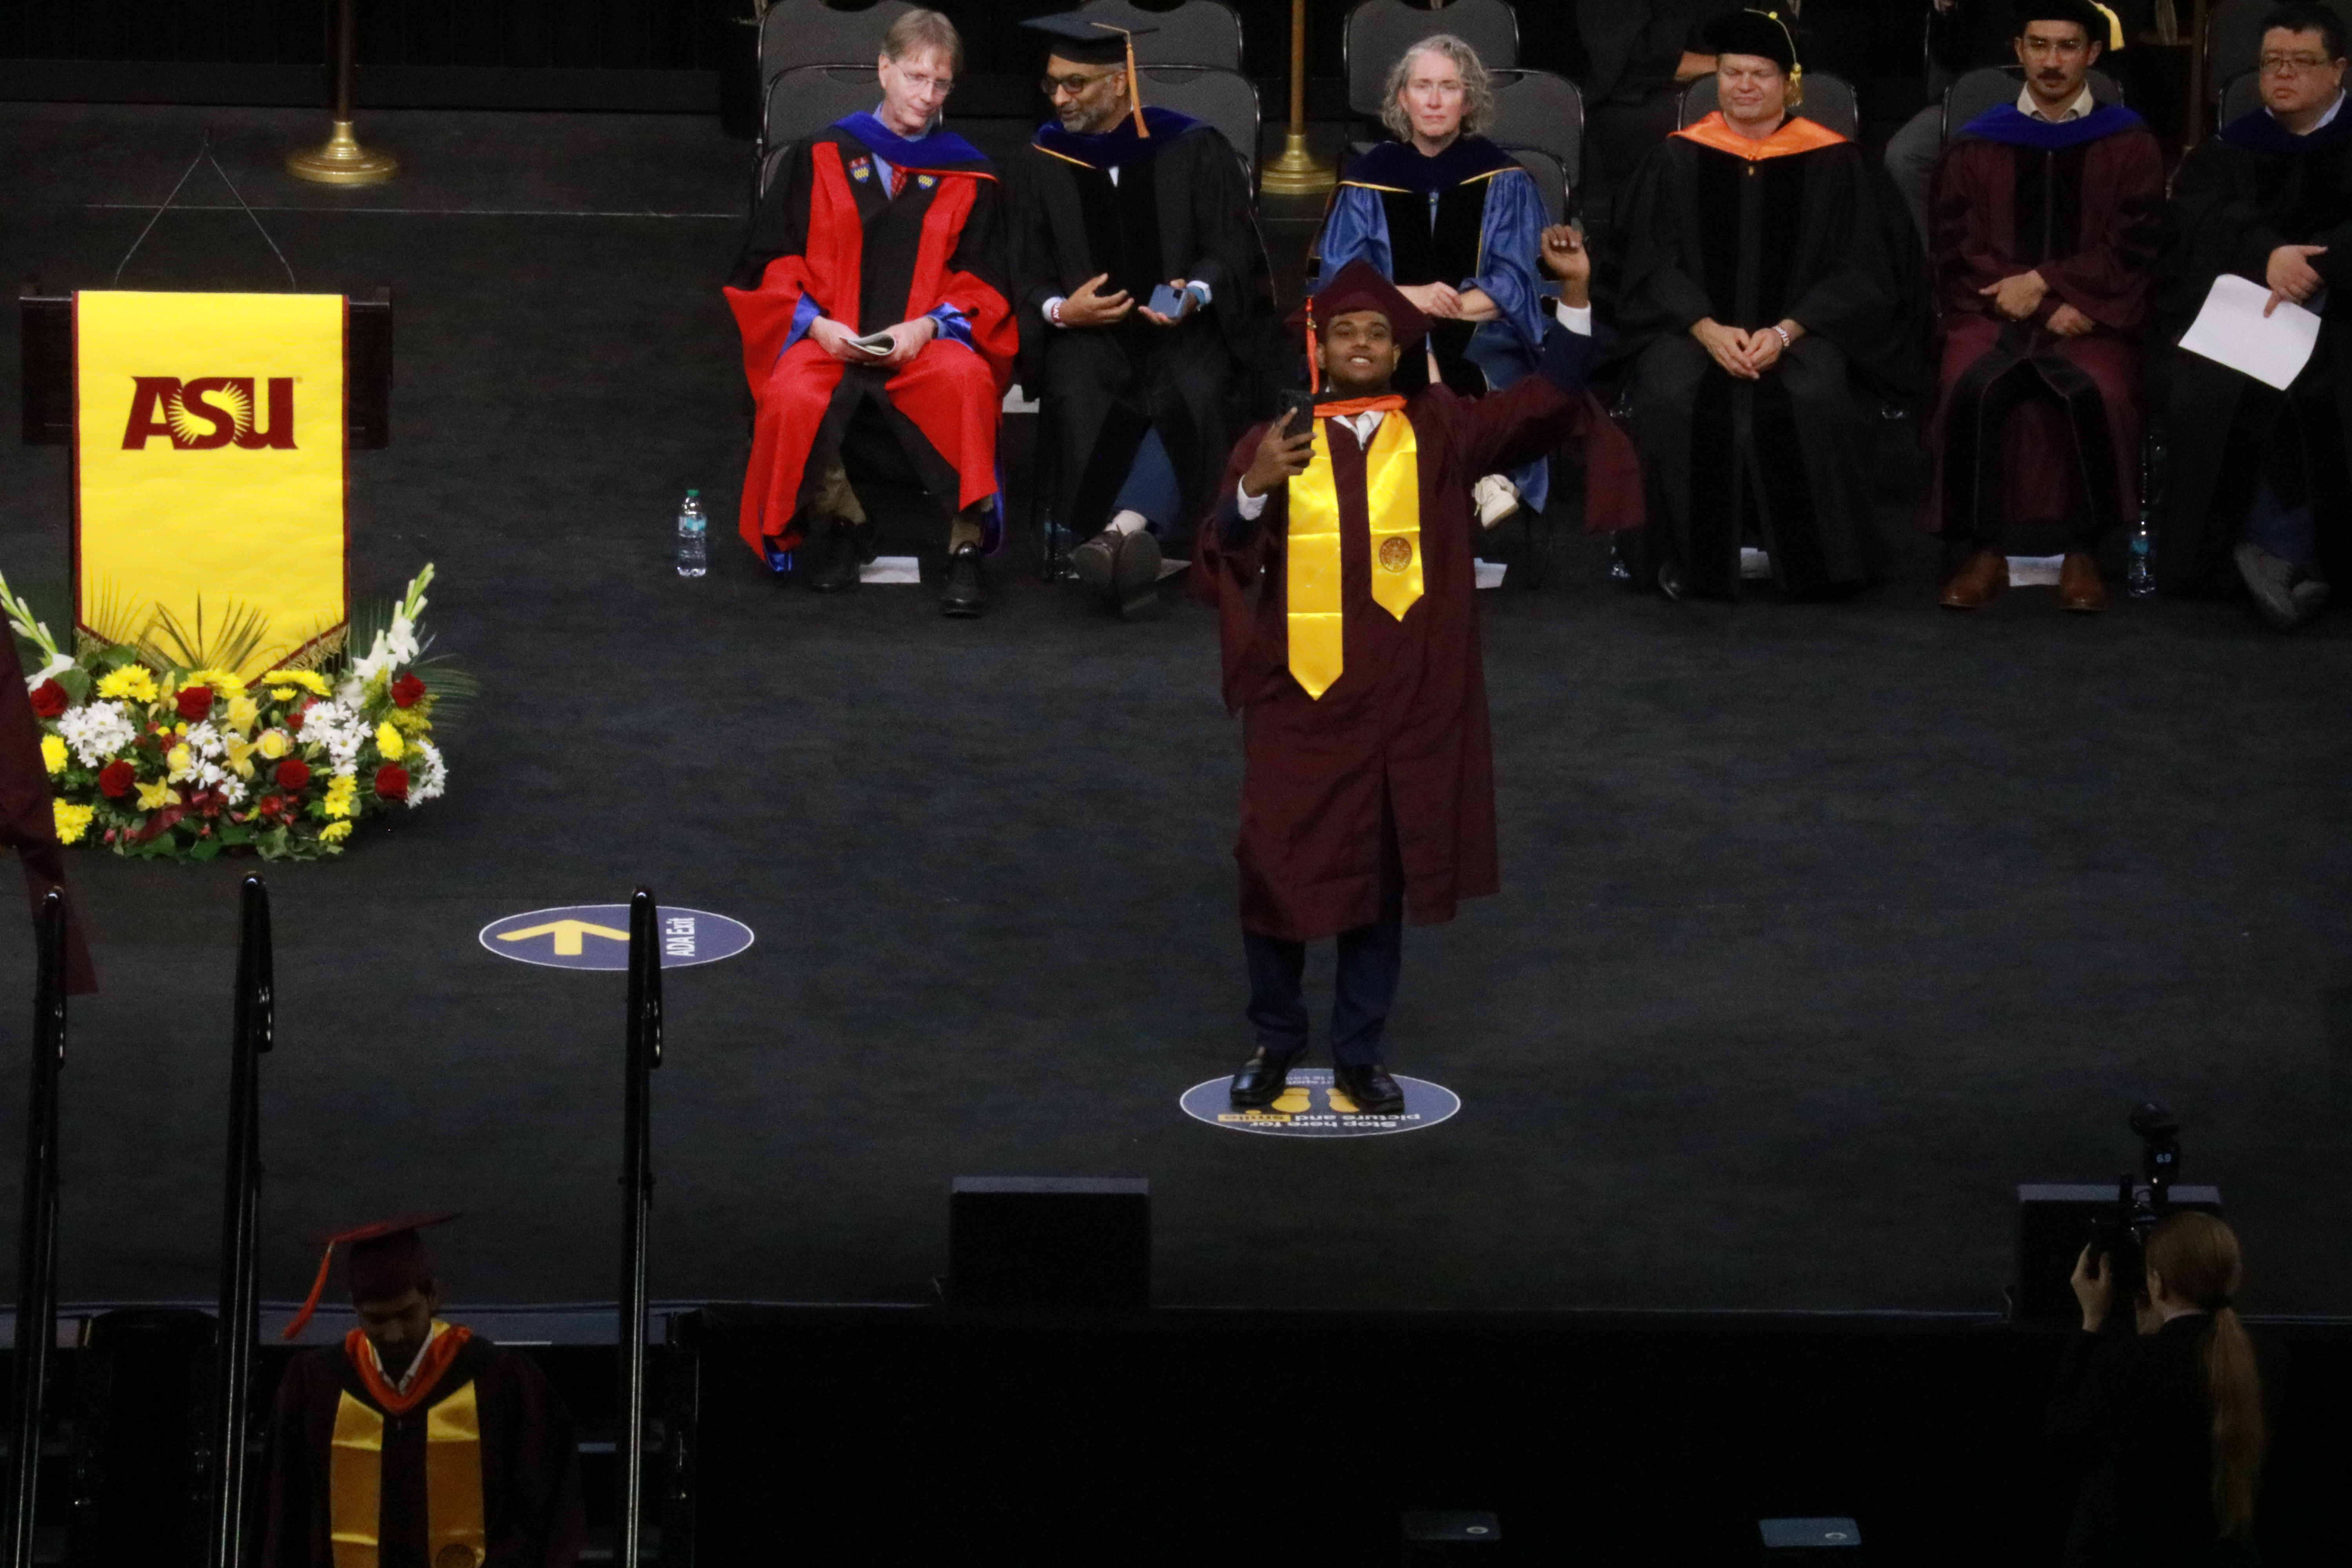
Masters Graduation
Walked across the stage at ASU to receive my Master's degree in Data Science, the culmination of two years of research, hackathons, and building.

About
I am building my career at the intersection of data science, analytics, and AI product engineering. My work spans business-facing analysis, predictive modeling, semantic search and matching, LLM applications, and the full-stack systems needed to make those ideas usable in practice.
Across my projects, I have worked on funnel analysis, pricing and margin audits, geospatial analytics, tail-risk modeling, resume-job semantic matching, AI agents, and interactive LLM-powered platforms. That range is intentional. I like solving problems where data, product thinking, and engineering all need to come together.
I do not want to be limited to a narrow analyst label. I want to build systems that are technically strong and useful in the real world, whether that means designing a warehouse model, evaluating an ML pipeline, shipping an AI interface, or translating a messy dataset into a decision someone can act on immediately.

Data Science Thinking
I work from problem framing to model evaluation, using statistics, ML, and experimentation to answer questions that matter to the business rather than optimizing for technical novelty alone.
Analytics with Actionability
My analytics work is built around decisions: margin recovery, funnel optimization, risk detection, forecasting direction, and operational clarity for teams that need an answer now.
LLM Product Building
I design and ship LLM-powered systems for planning, simulation, semantic matching, education, and workflow automation, with a focus on useful interfaces and grounded outputs.
End-to-End Execution
I am comfortable moving across SQL, ETL, dashboards, APIs, full-stack apps, and deployment workflows, which lets me take an idea from raw data all the way to a usable product.
Experience

Jan 2026 to Present
The AI Society at ASU
Tempe, AZ
Jan 2026 to Mar 2026
The Unit of Data Science & Analytics Lab ASU
Tempe, AZ
Oct 2025 to Feb 2026
Devlabs
Tempe, AZ
May 2023 to Jul 2023
Amrutanjan HealthCare Ltd.
Chennai, India
Dec 2022 to Jun 2023
Vellore Institute of Technology
Chennai, India
Project writeups are now grouped by domain. The section opens on Data Analytics and shows one category at a time so each body of work reads as a focused collection instead of a wall of cards.
Active category
SQL-heavy audits, dashboarding, ETL, and operational decision support.
Margin recovery and waste mitigation within the Dairy category
An automated ETL pipeline to balance revenue recovery with community accessibility, identifying instances of margin erosion and waste accumulation.
Pinpointing where customers drop off and why
A 5-stage conversion funnel built on BigQuery analyzing 2,300+ user events to surface stage-by-stage drop-offs and inform channel budget allocation.
Microburst impact assessment and tree risk management
An interactive geospatial dashboard mapping 40,000+ Tempe trees to surface storm-vulnerable corridors, environmental impact, and canopy risk trends.
Gallery
A visual walkthrough of hackathon victories, community workshops, and leadership moments that shaped my technical journey.

May 2026
Walked across the stage at ASU to receive my Master's degree in Data Science, the culmination of two years of research, hackathons, and building.
May 2026
Presented our NPA Digital Twin solution at the Cognite office during the Arizona Nerd Network (AZNN) May meet.
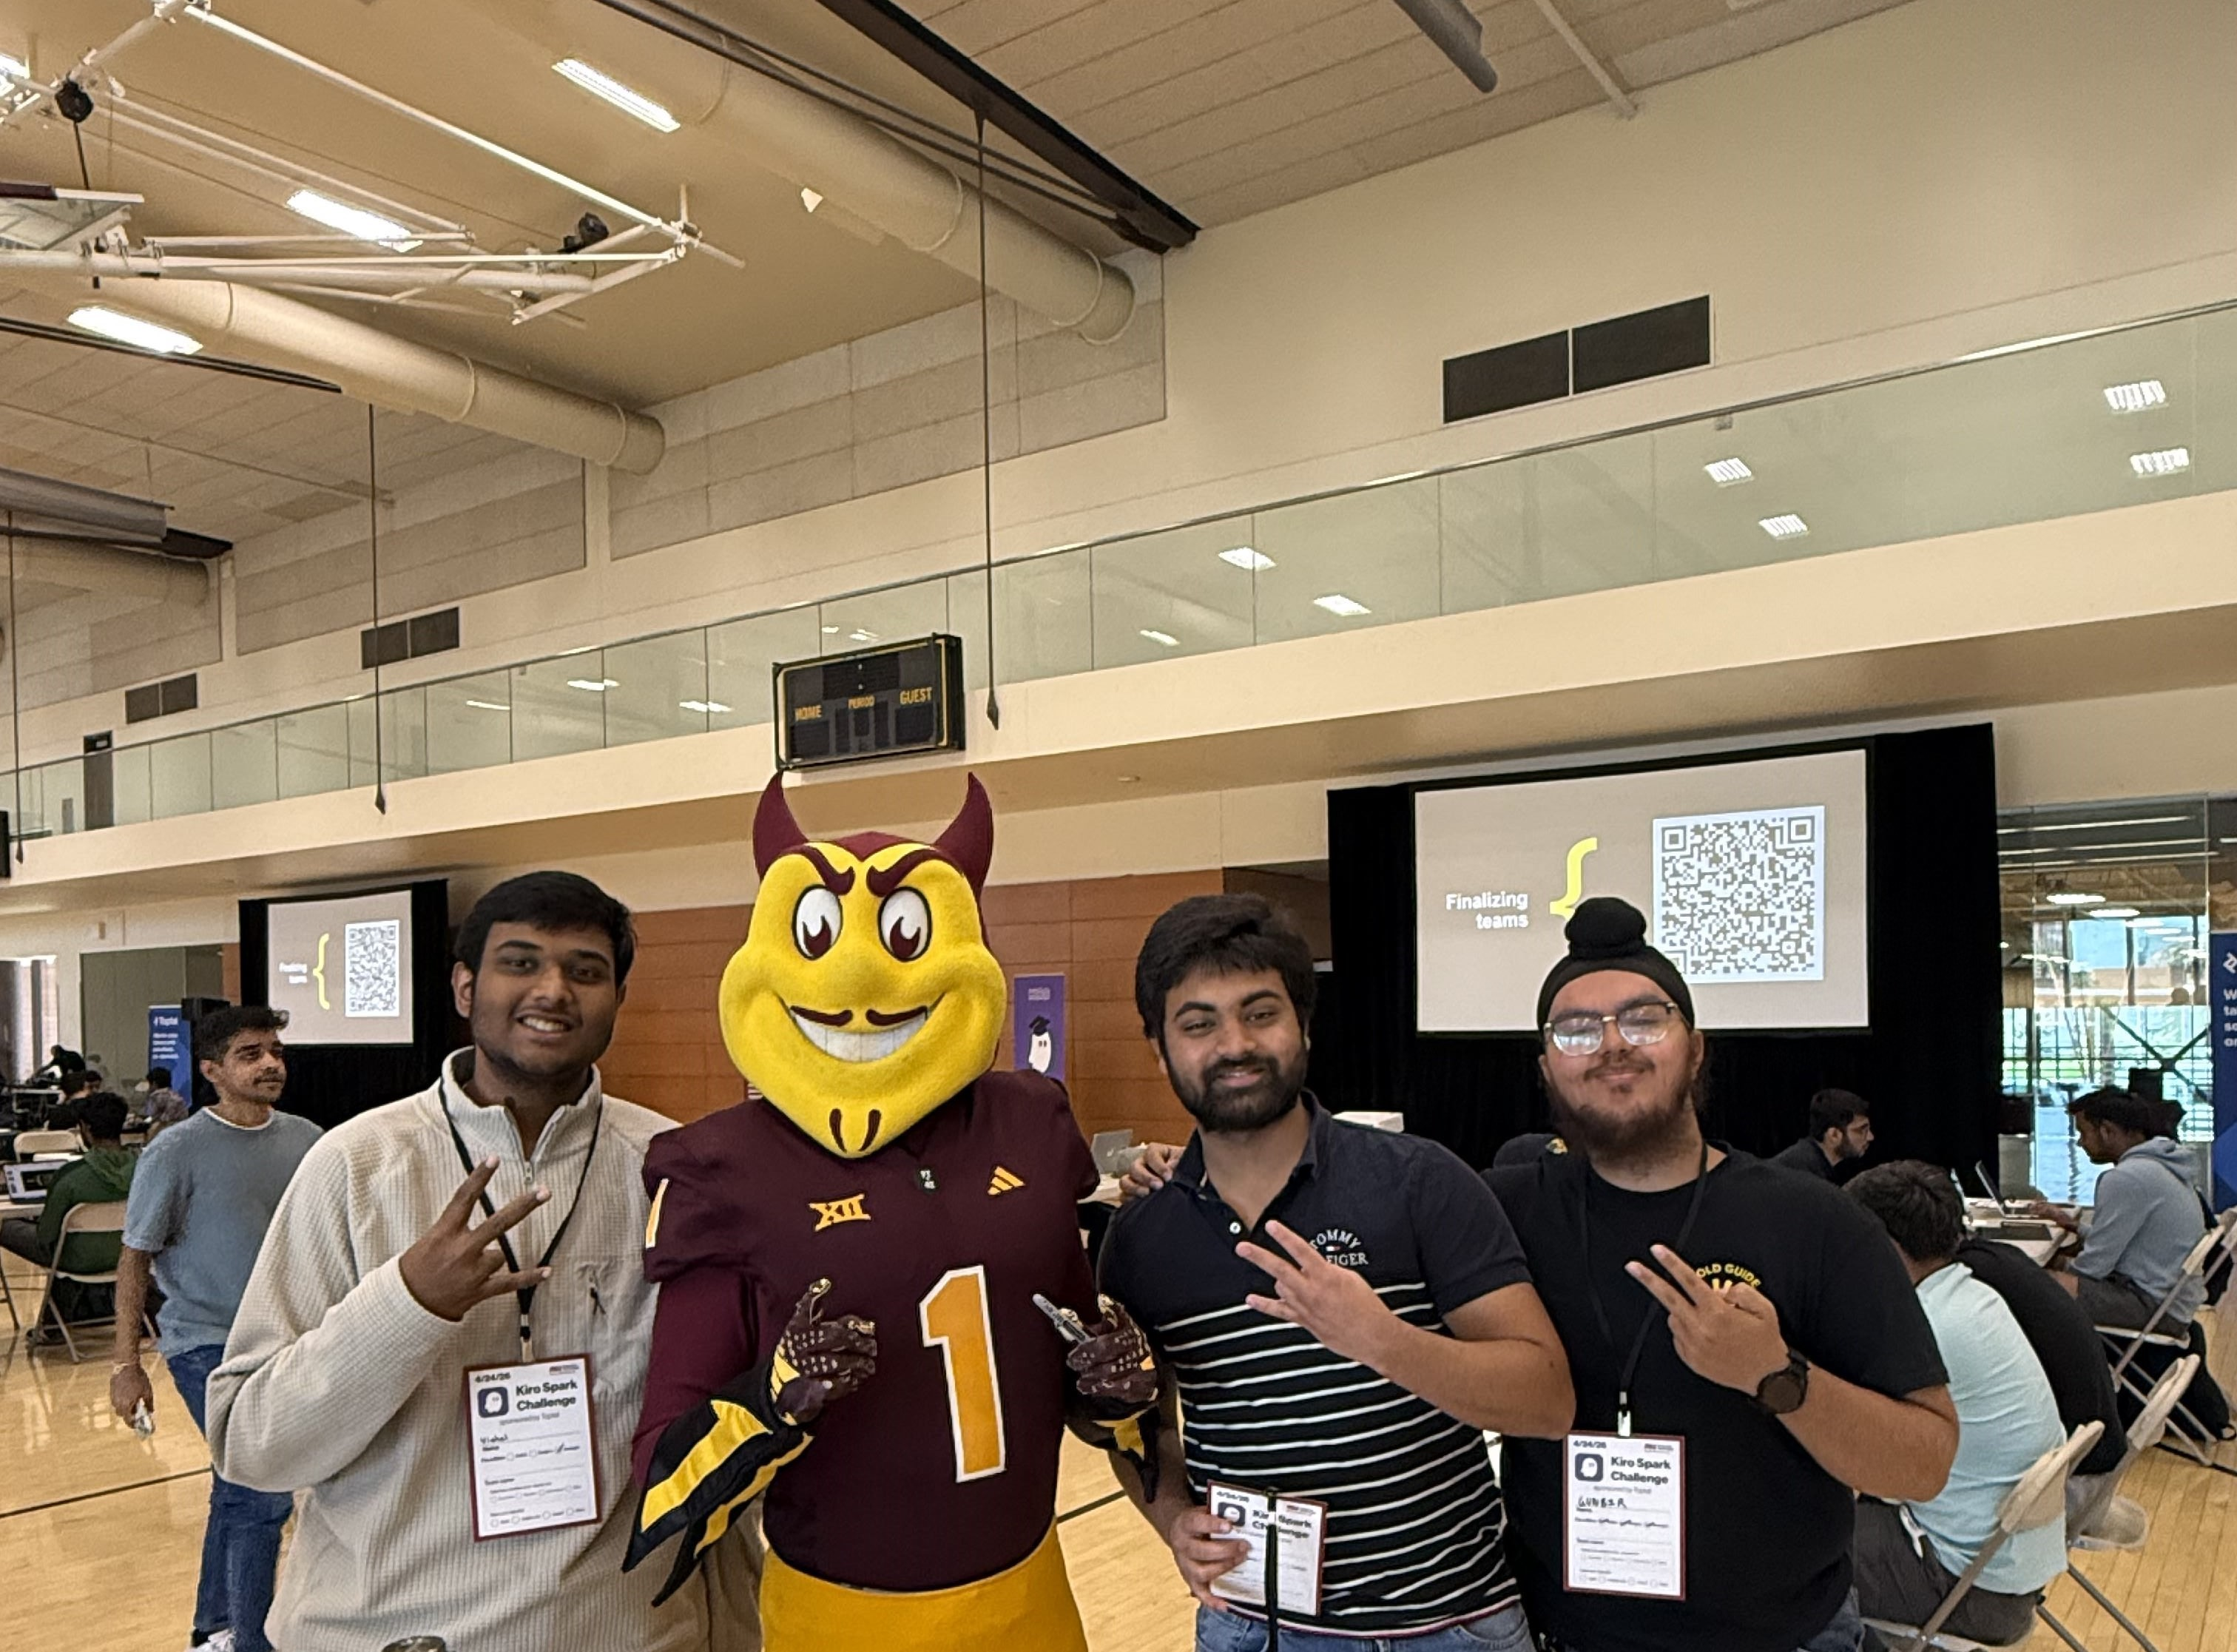
April 2026
My 8th Hackathon Victory. Won the Impact Track at the Kiro Spark Challenge by building Inference Network, a project focused on making AI more accessible and sustainable.
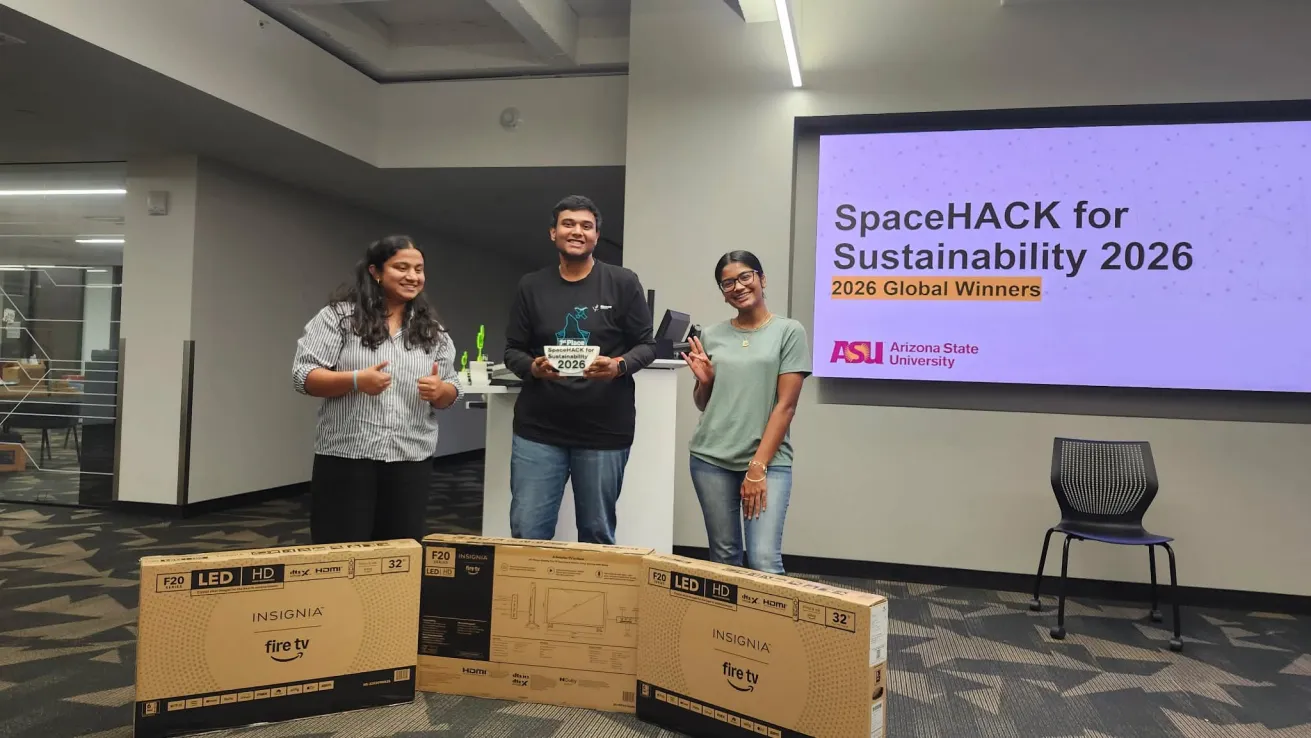
April 2026
Global Winner and Overall Champion of SpaceHack for Sustainability 2026, competing alongside universities and participants from Paris, the Netherlands, Ecuador, Puerto Rico, and Bulgaria.
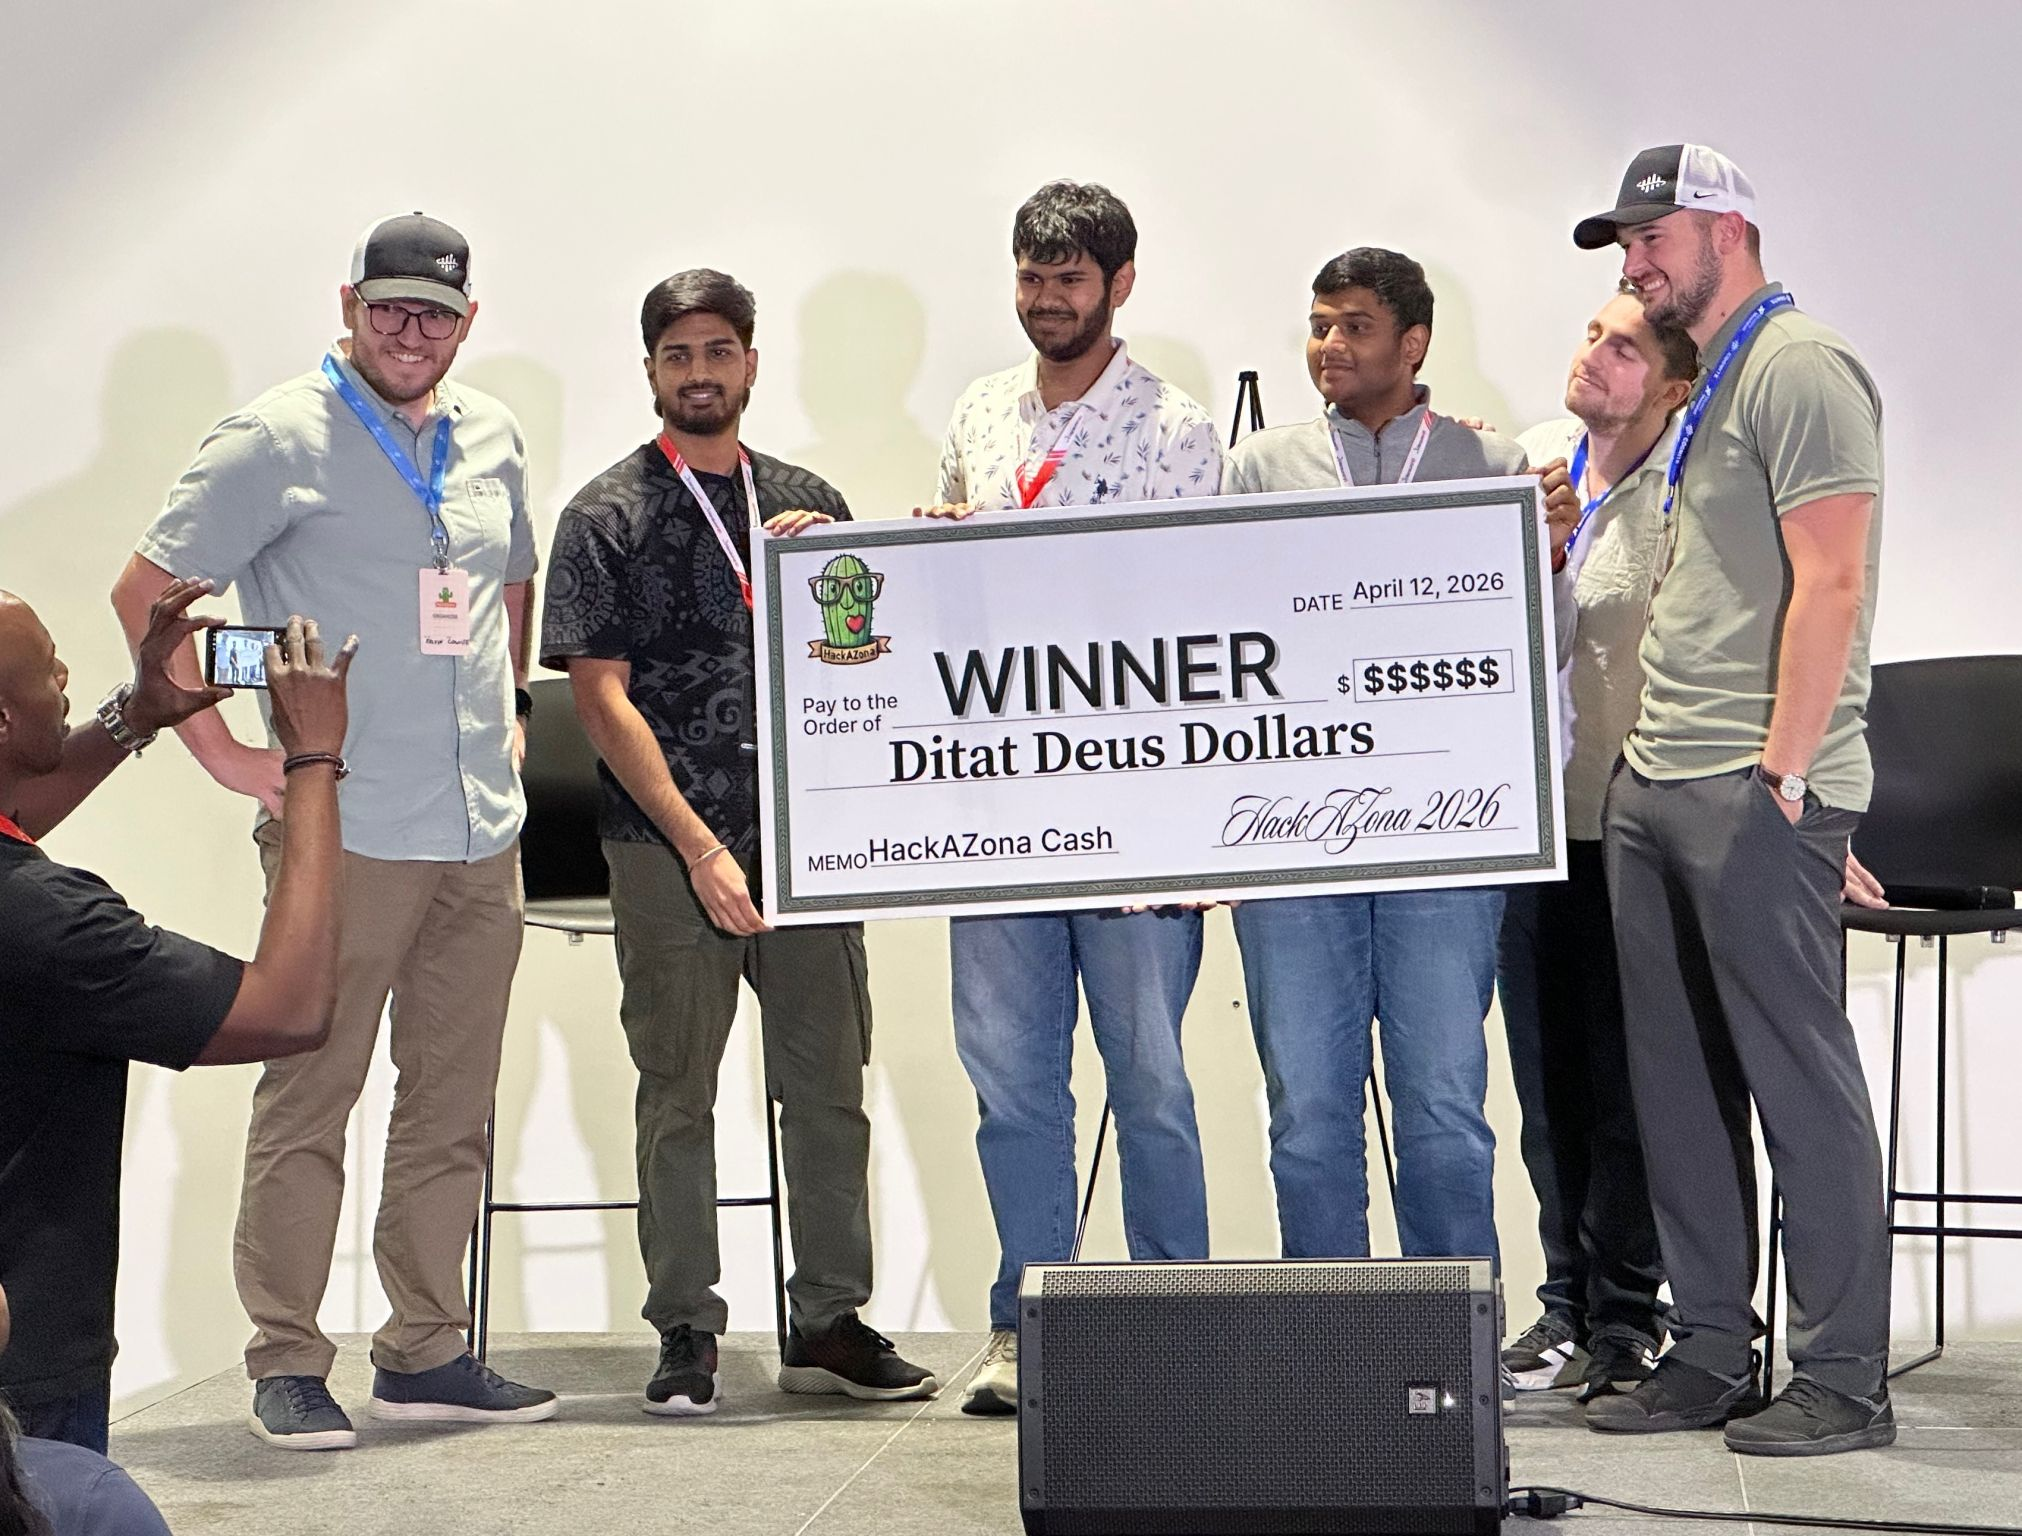
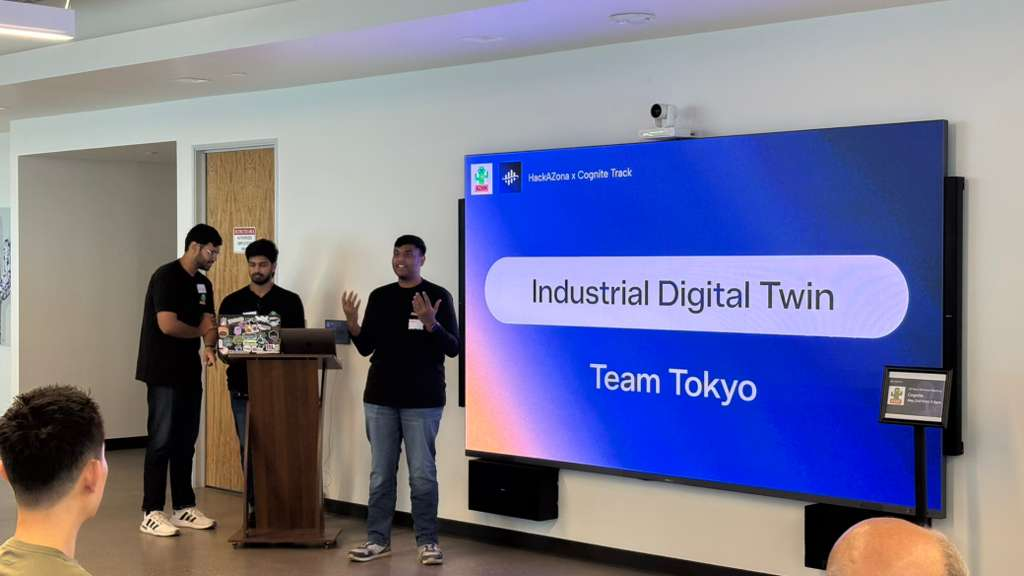
April 2026
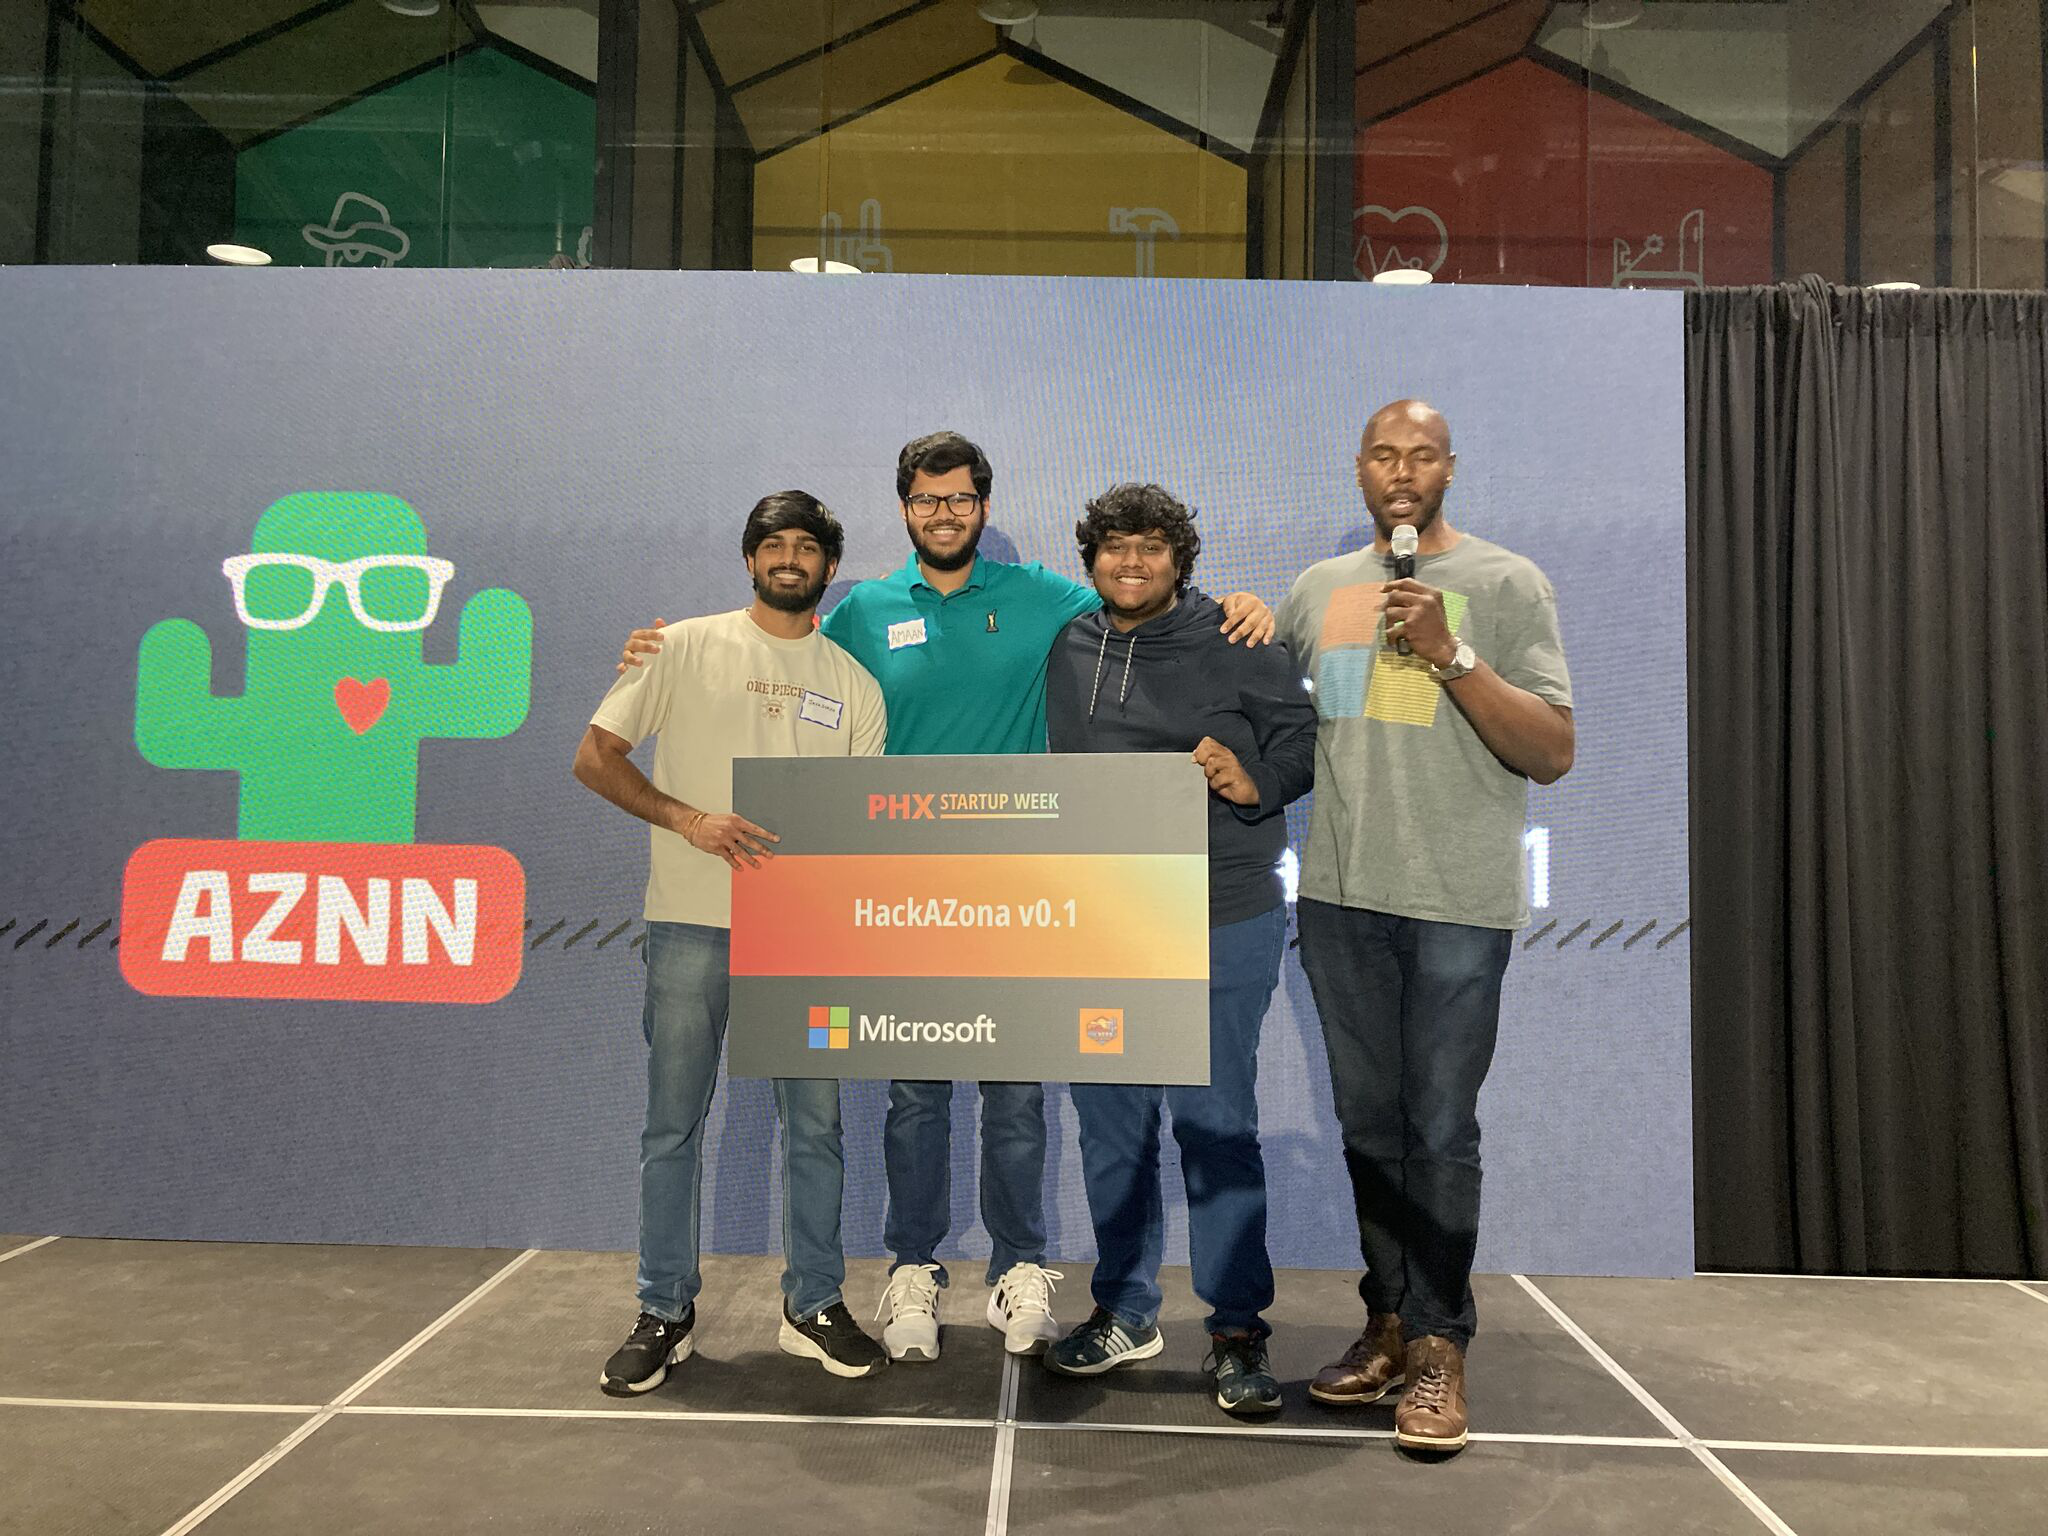
My 7th Hackathon Victory. Team Tokyo won the HackAZona Cognite Track by building the NPA Digital Twin platform, transforming industrial time-series sensor data into an interactive 3D monitoring environment.
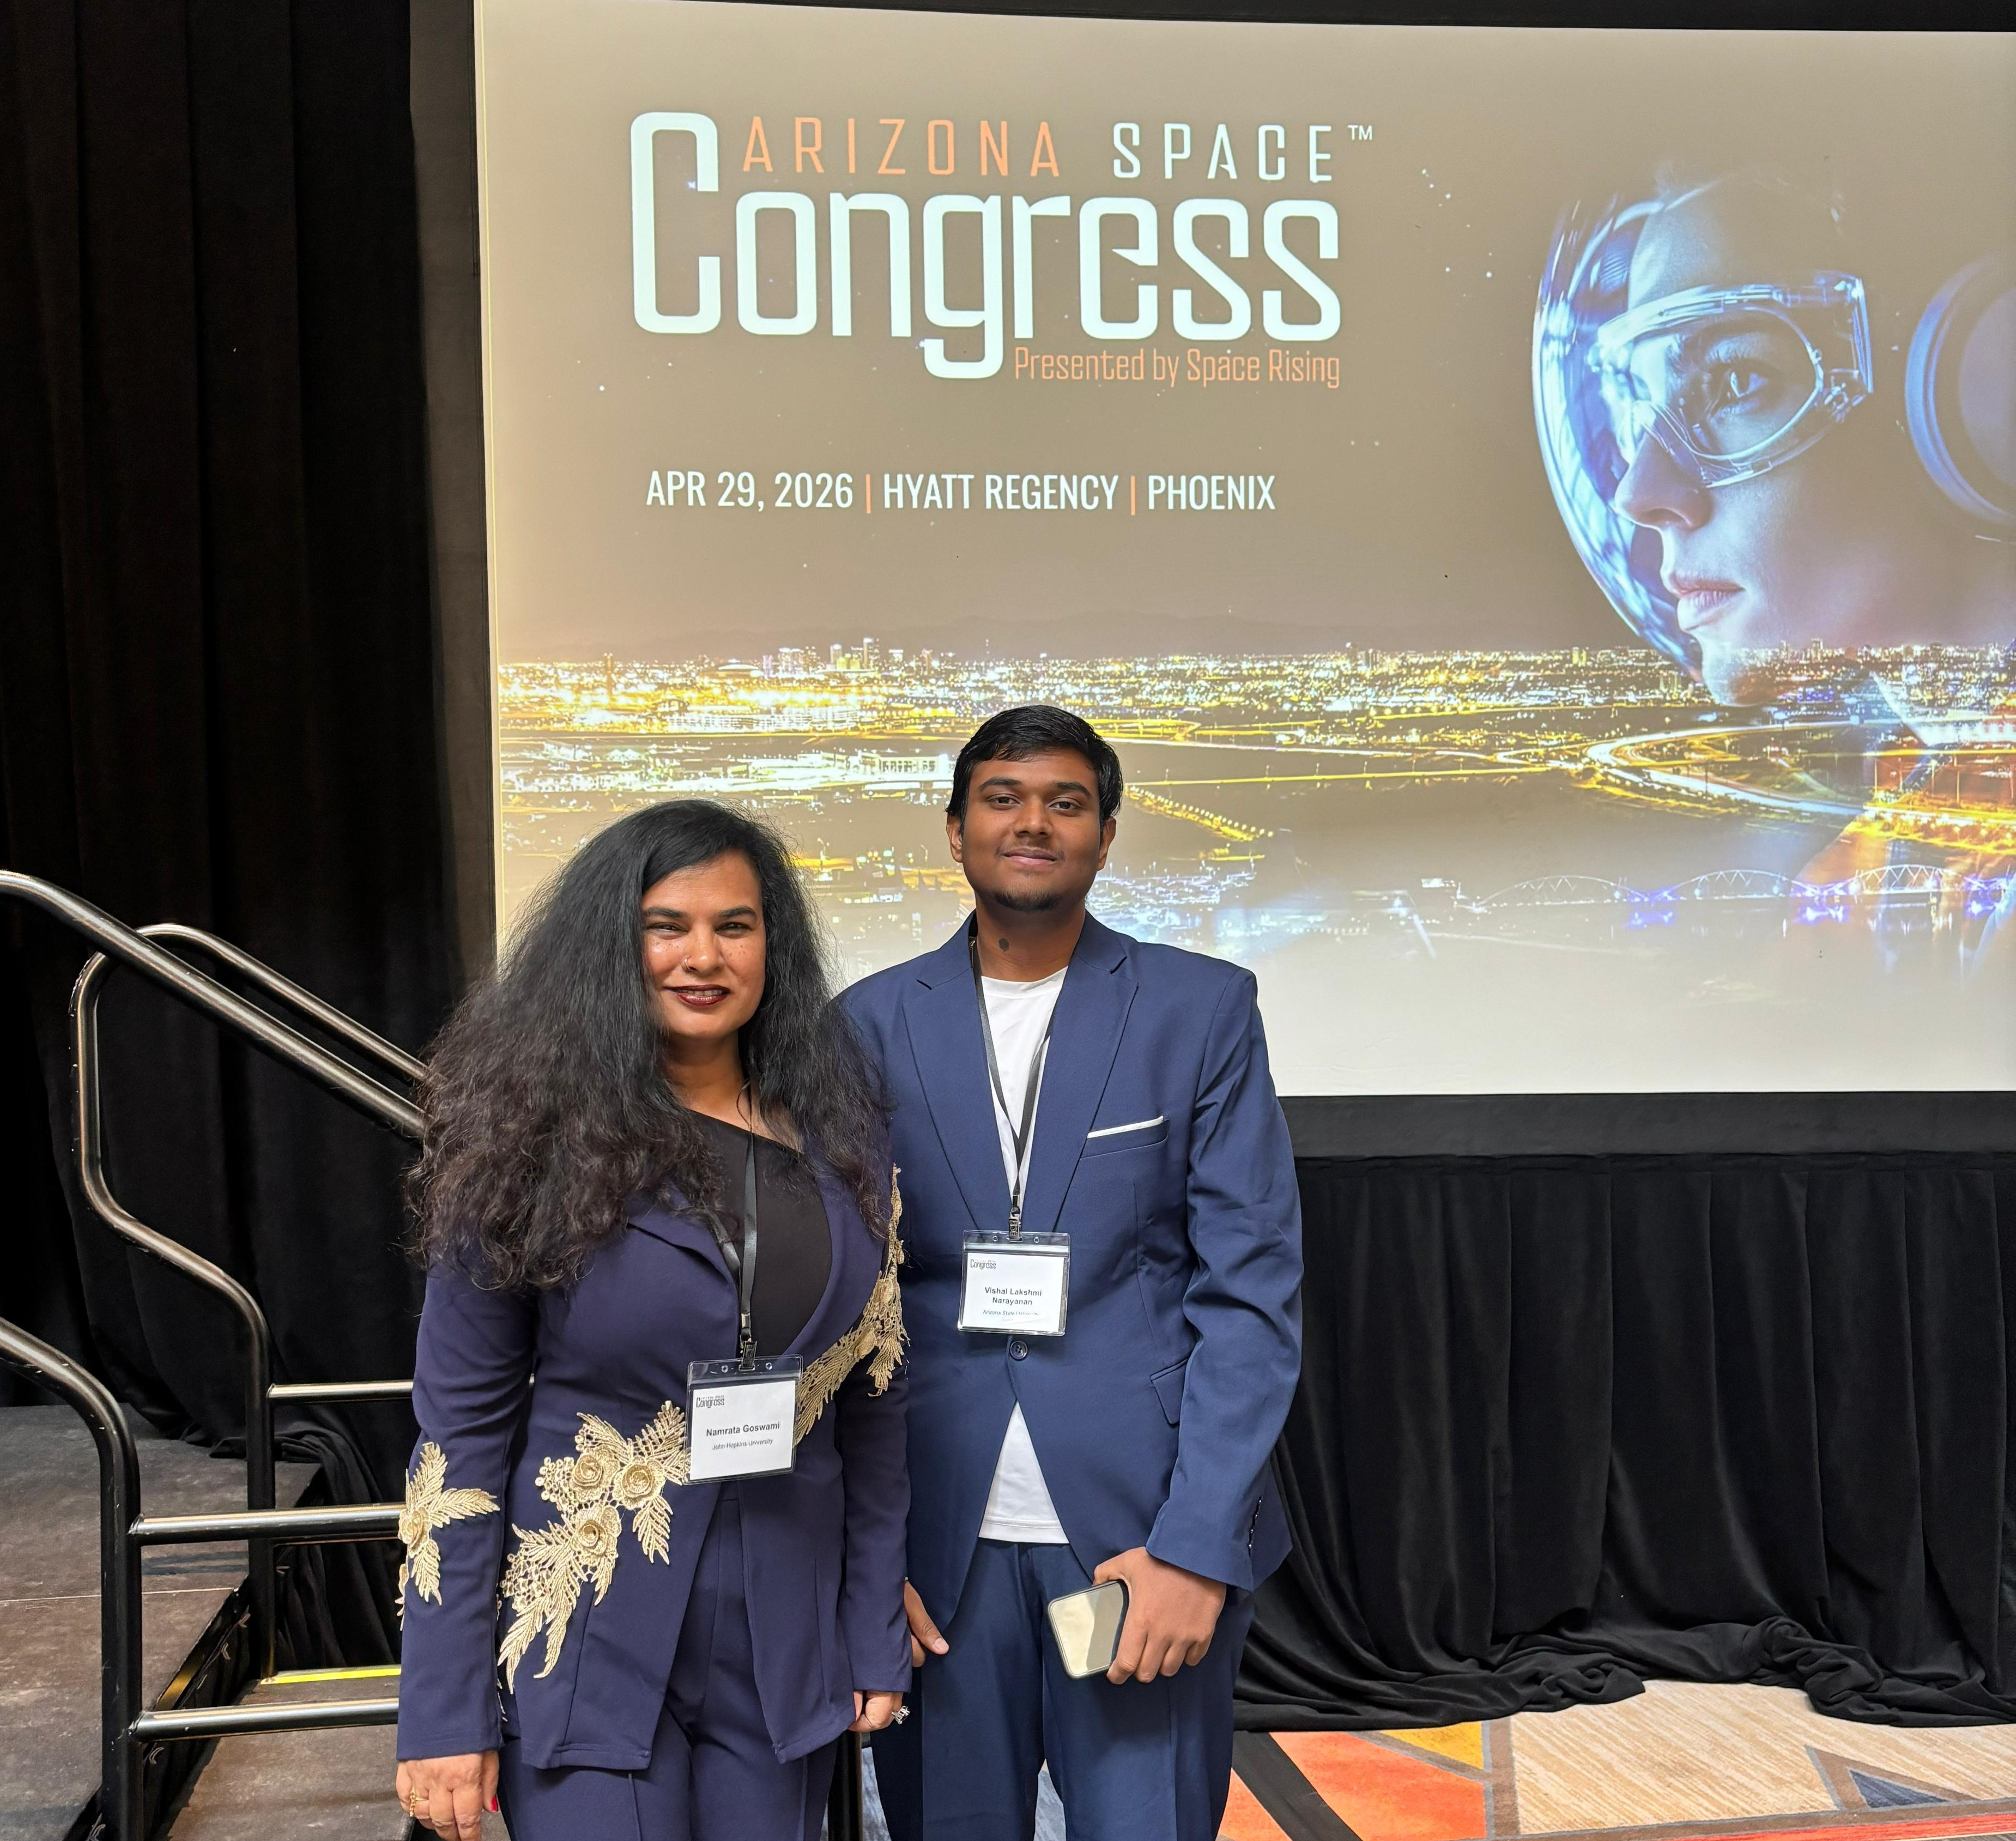
April 2026
Attended the Space Rising conference at Arizona Space Congress to explore Arizona's growing role in the global space economy and ecosystem.
April 2026
Presented my final capstone project on Predicting Equity-Based Disaster Response and Resource Optimization.
March 2026
My 4th Hackathon Victory! Built AI Personas that provides reasoning and justification, that purely judges you in a high stake meeting based environment. Gamified experience to stress test human reasoning.
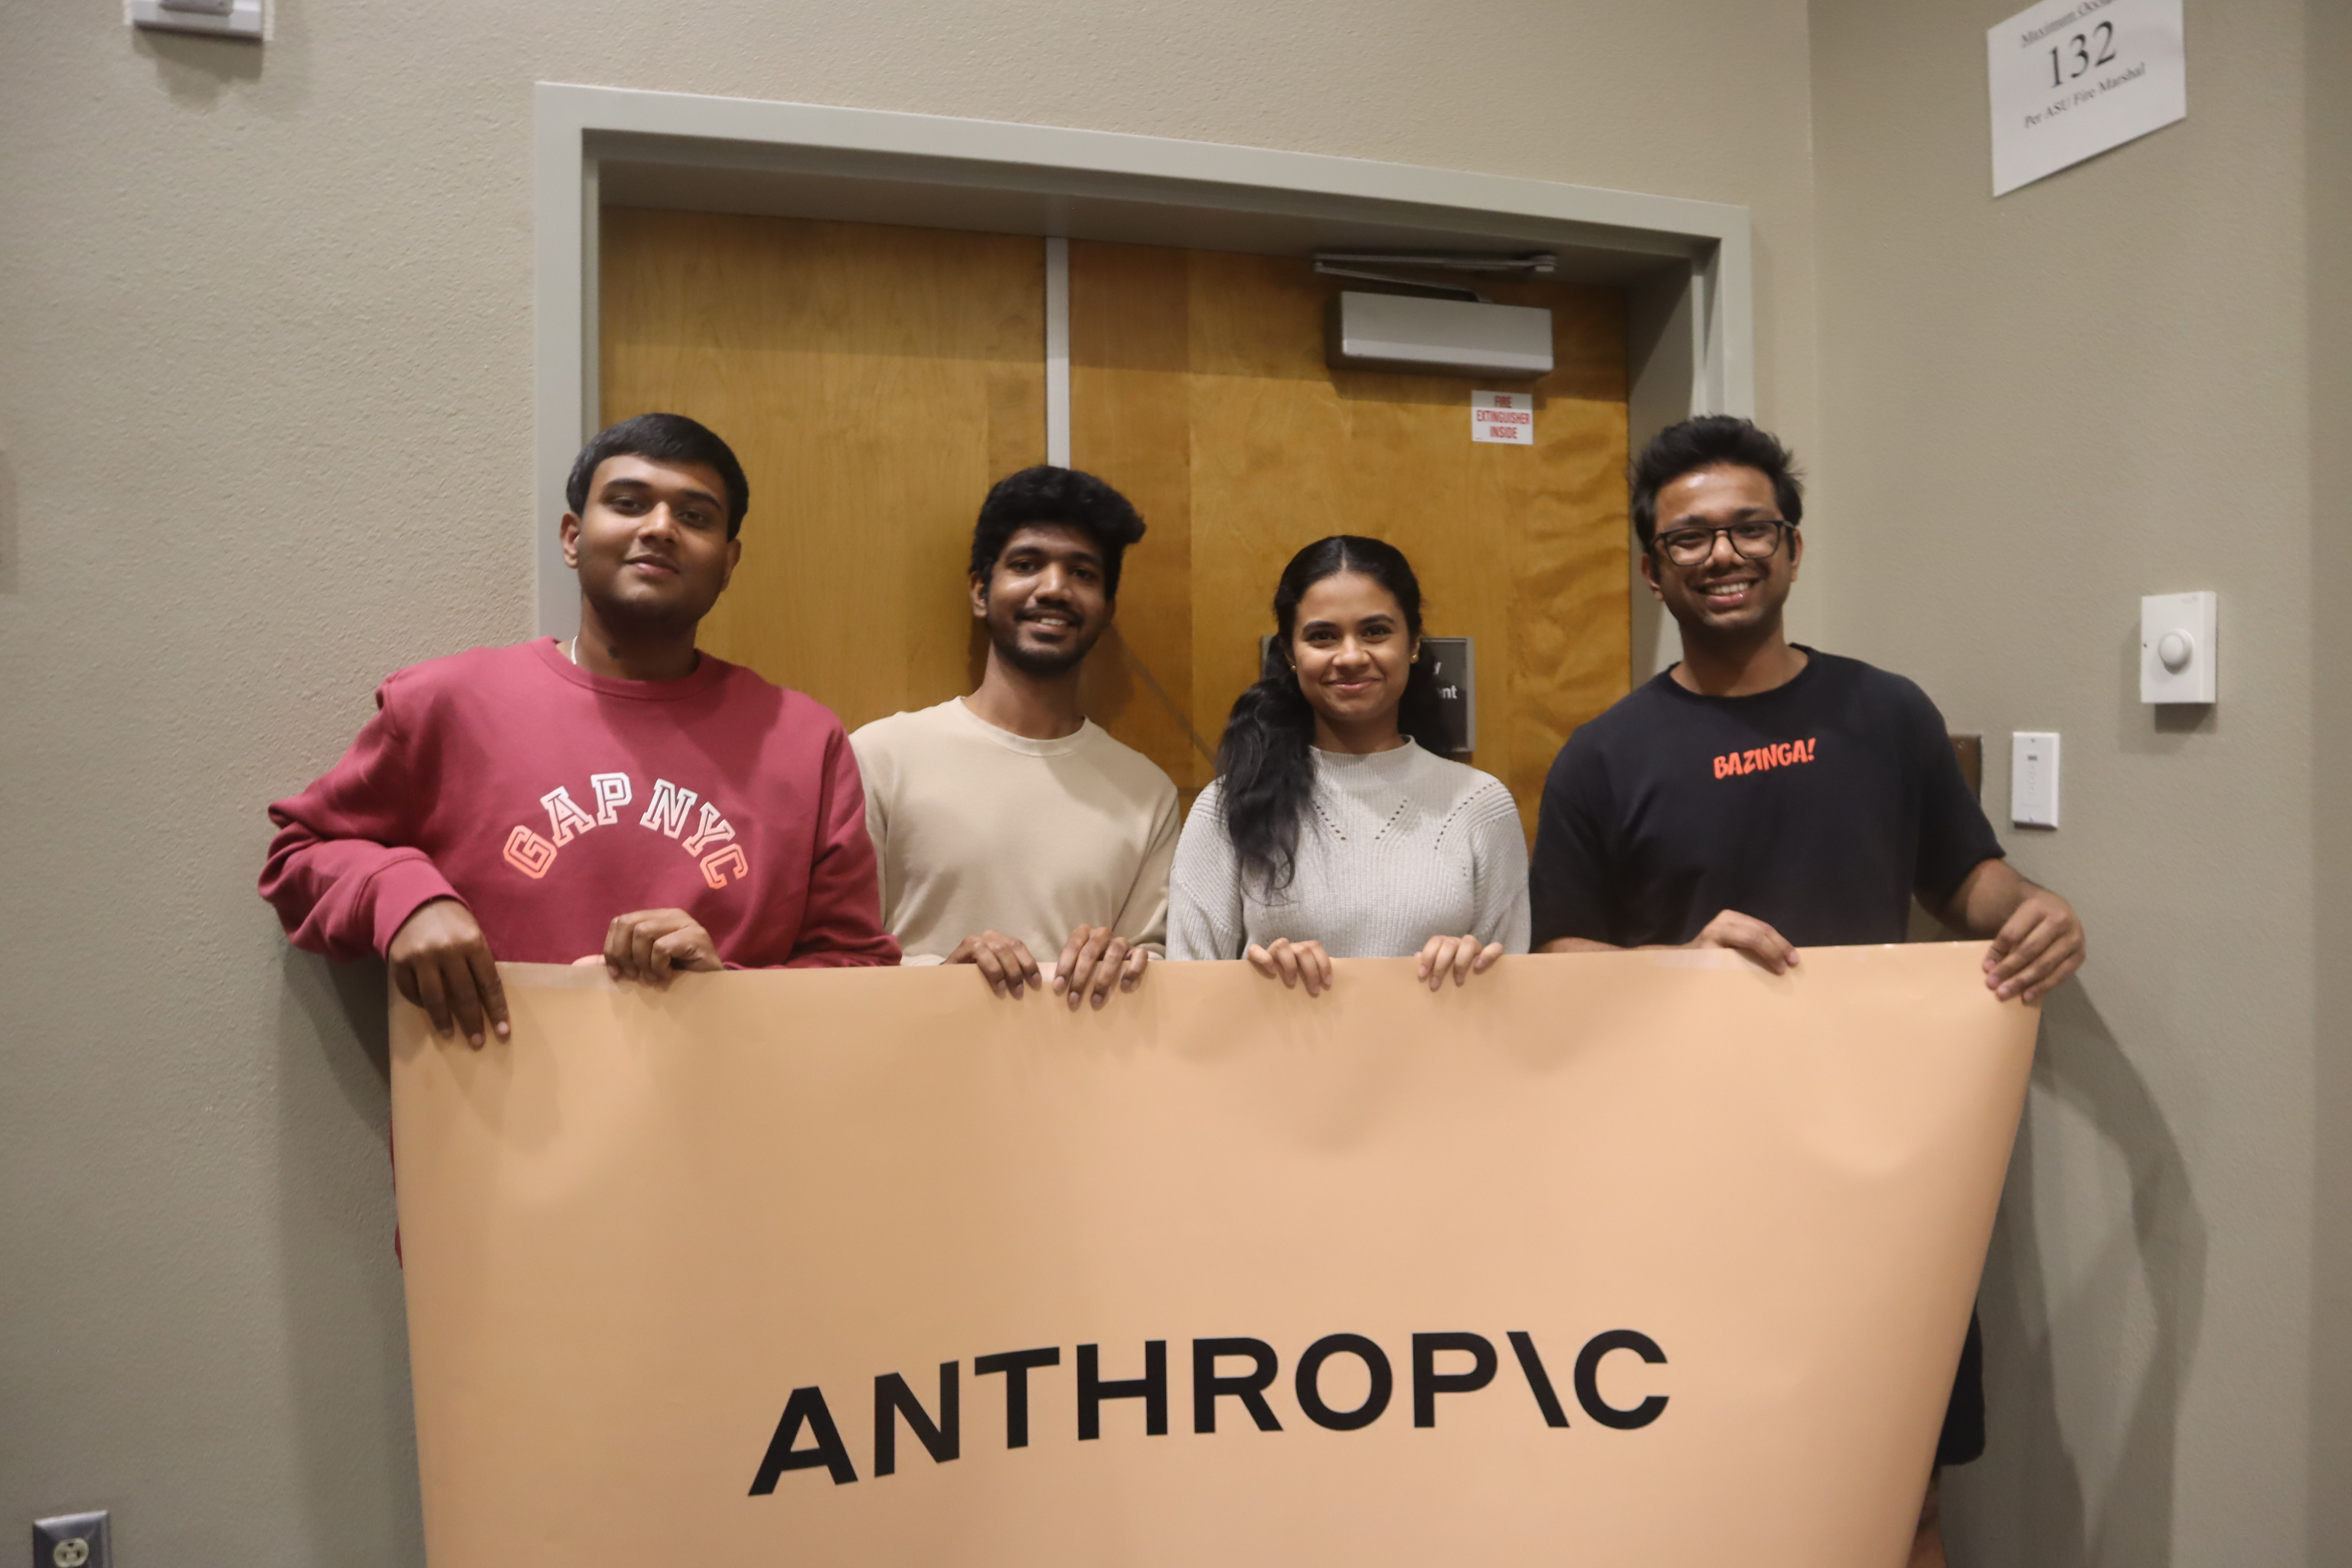
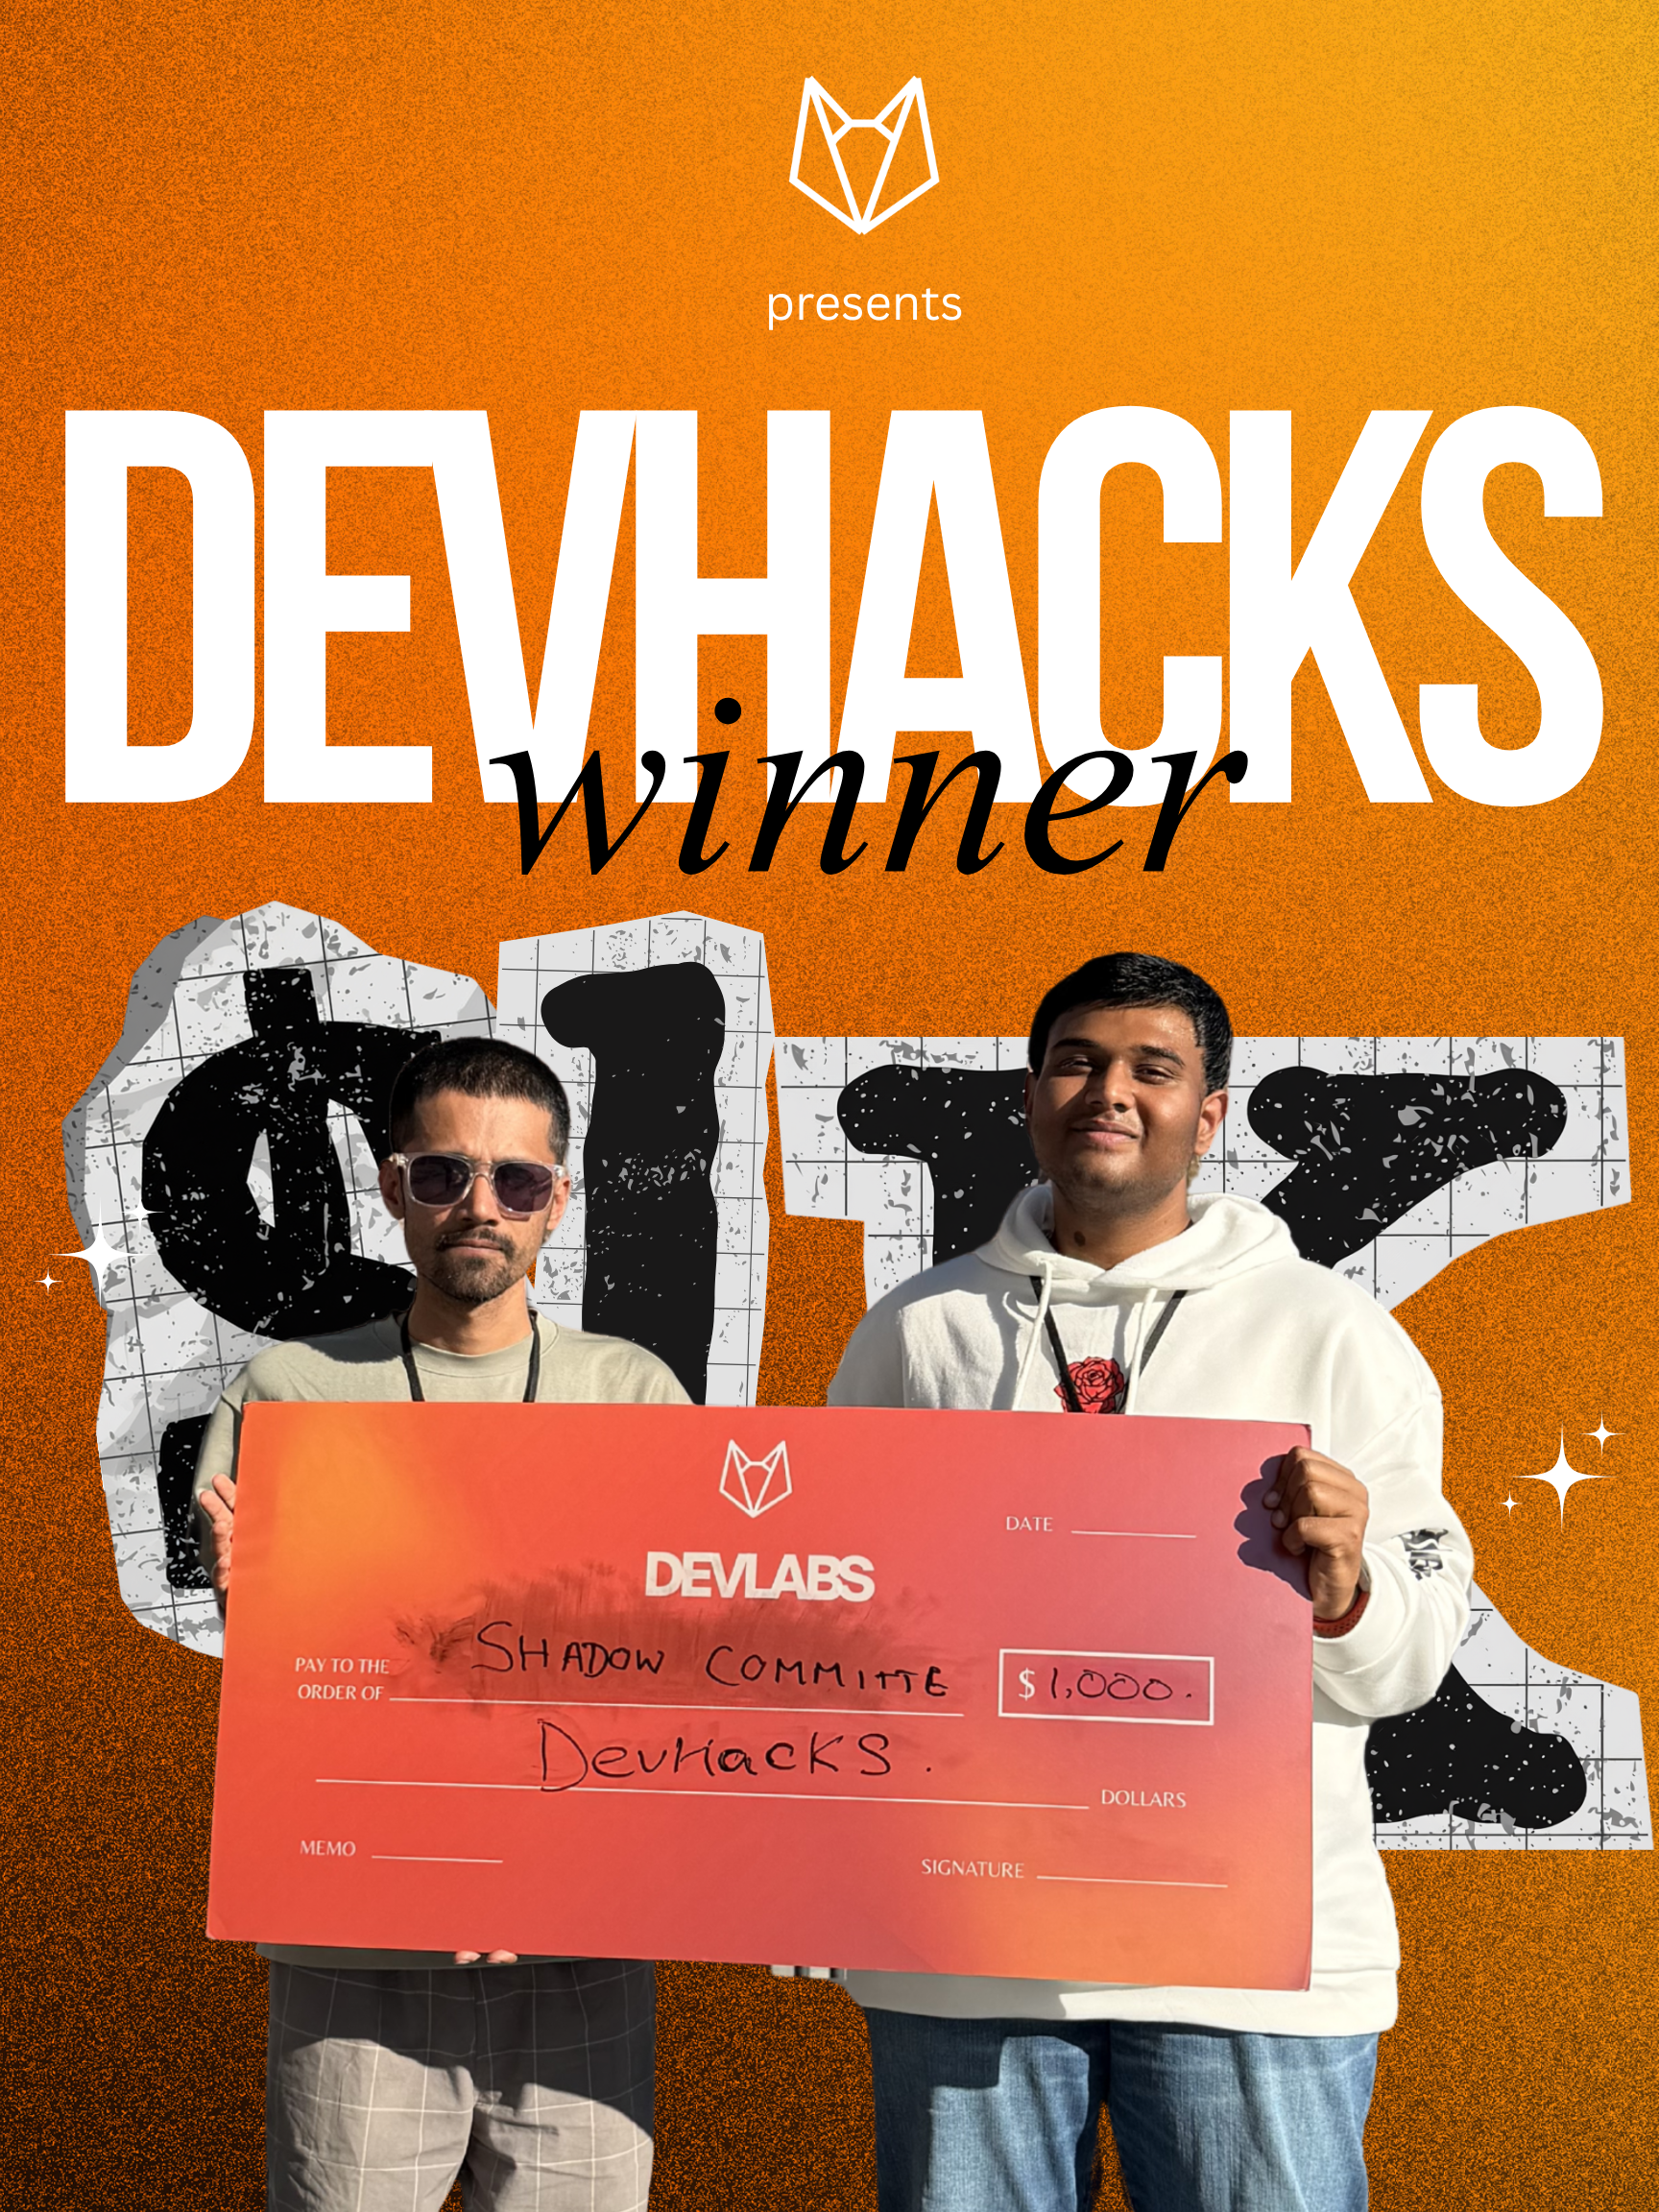
March 2026
Participated in the HackASU hackathon with the Claude Builders Club and won the Go Viral, Win Big track sponsored by TamaGrow.
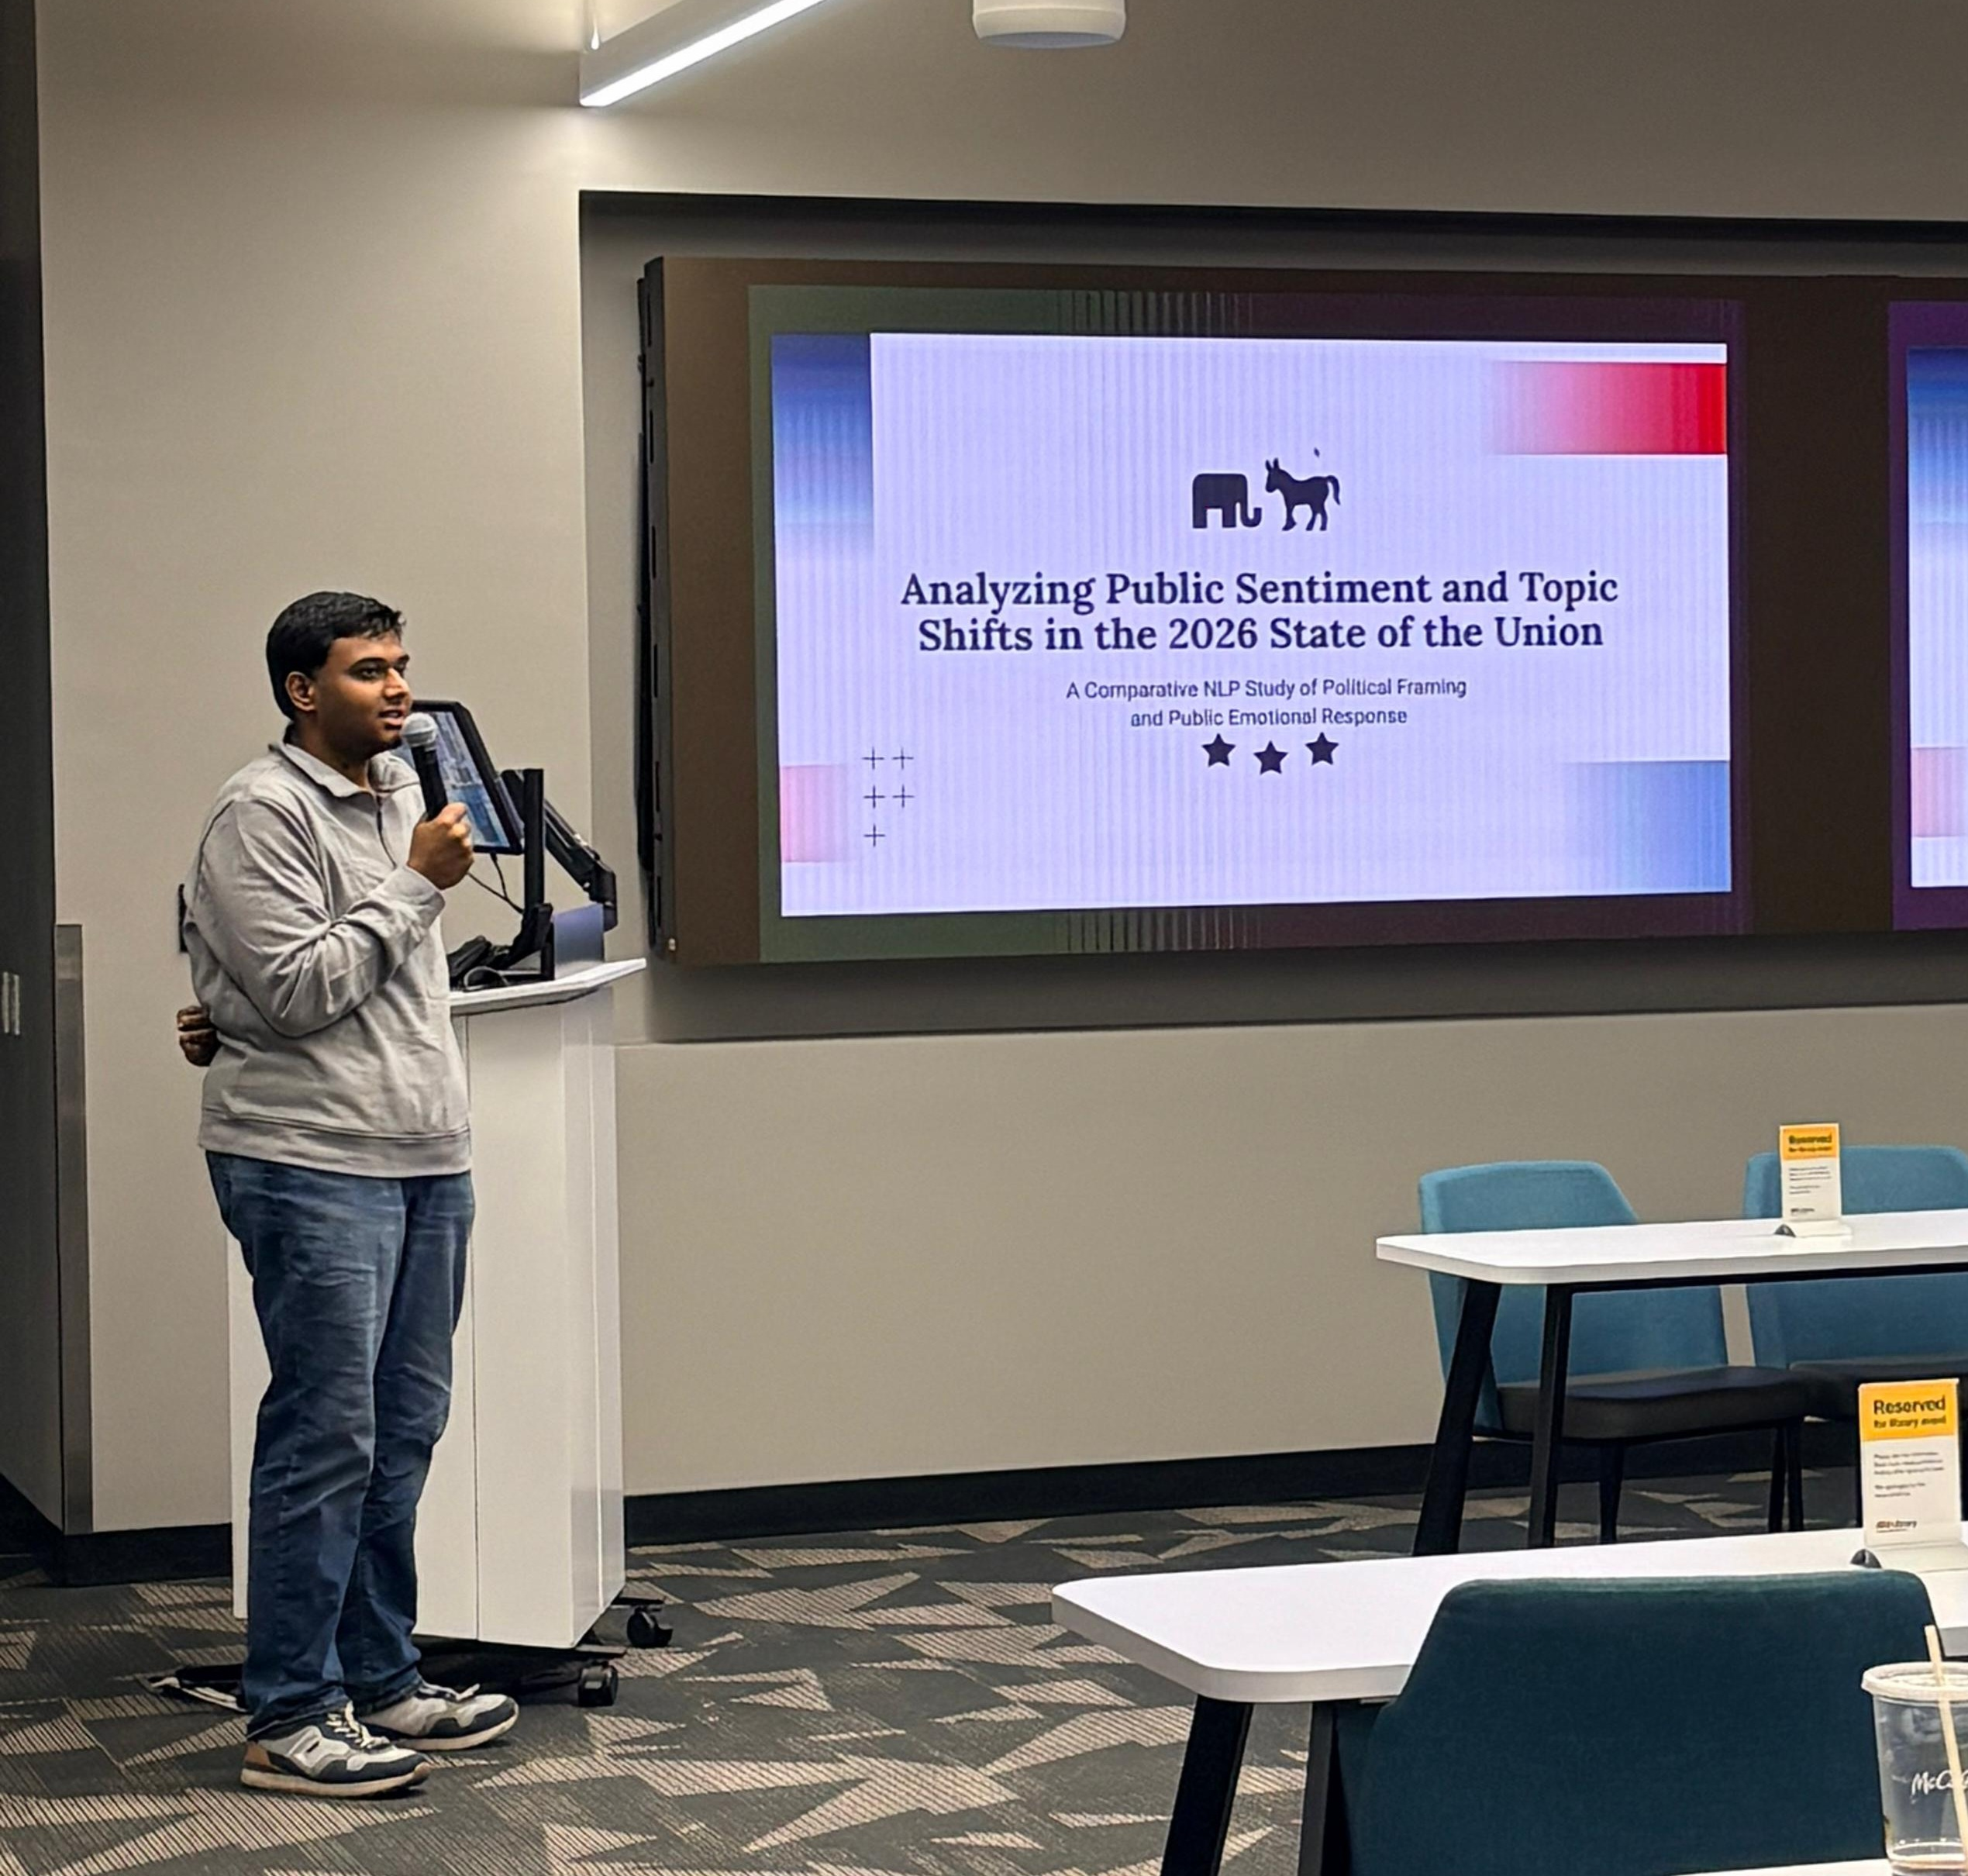
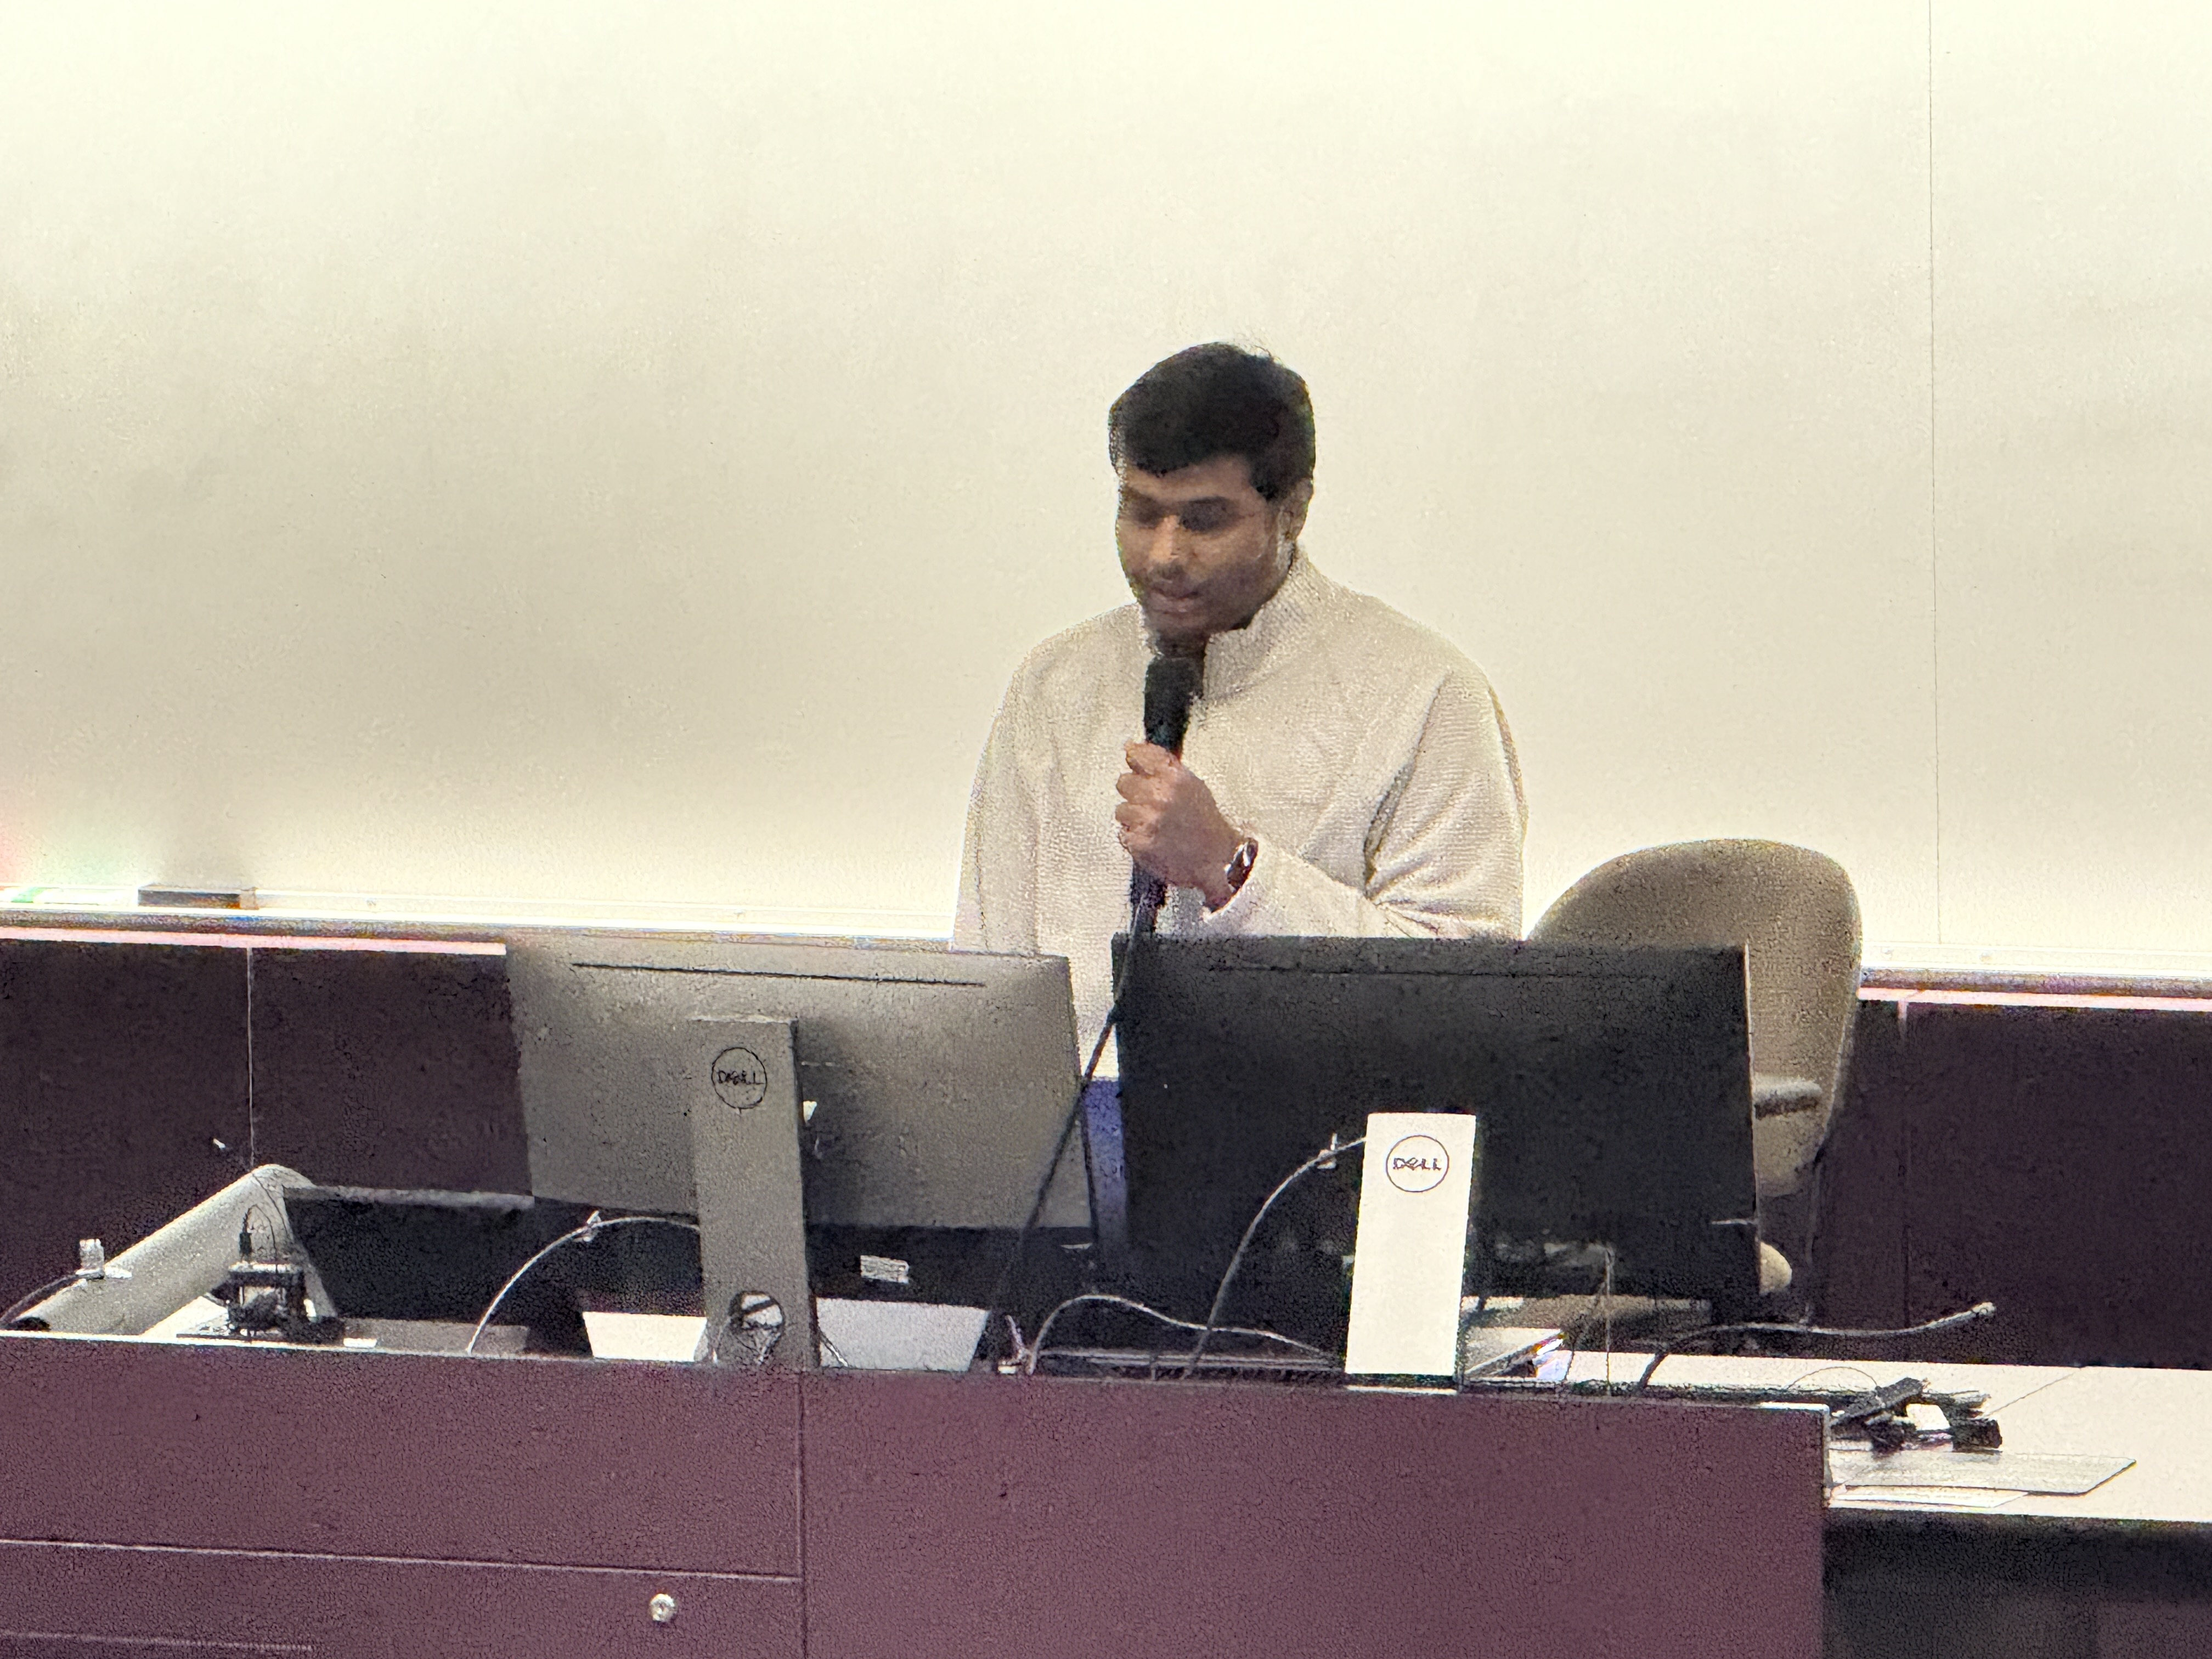
March 2026
The closing presentation from my 8-week work with the Unit of Data Science and Analytics Lab, presenting findings from an NLP analysis on topic shifts and public sentiment around the 2026 State of the Union.
February 2026
The largest-scale AI event organized by the ASU AI Society, where I successfully led the information desk management.
November 2025
Helped 5 teams architect their hackathon ideas, assisting closely with the technical implementations of LLM-based frameworks.
October 2025
A hacker event focused entirely on social good—building tools for the community using AI and ensuring its use remains humane.
October 2025
Led an intensive technical workshop teaching engineering students how to build and deploy their own personal portfolio websites.
September 2025
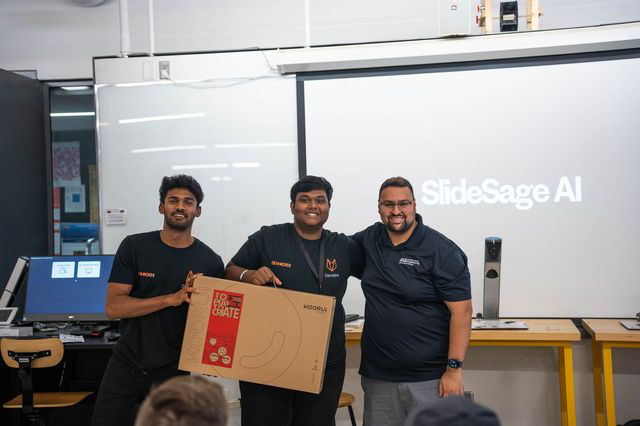
My 3rd Hackathon Victory! Built an AI video-based educating platform and won 1st place out of 175 participating teams as a solo developer.
March 2025
Built an agentic framework-based trip planner and won the People's Choice Award. The event was partnered with Microsoft Azure.
